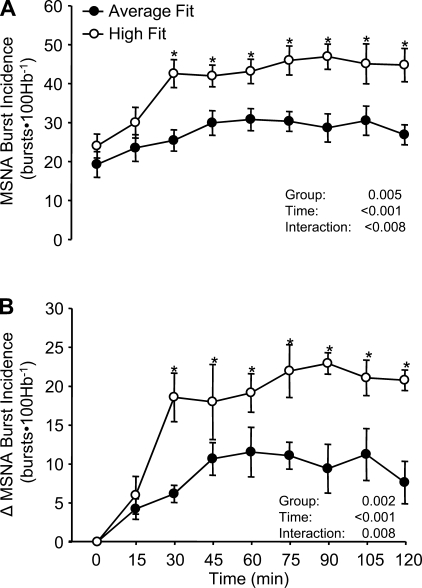
Fig. 3.
Mean MSNA burst incidence responses (A) at baseline (time 0) and for 120 min following consumption of the mixed meal in the average-fit and high-fit groups. Panel B shows the changes (Δ) in MSNA burst incidence from baseline in both groups. Hb, heart beats. Values are means ± SE. *P < 0.05 vs. average fit.

