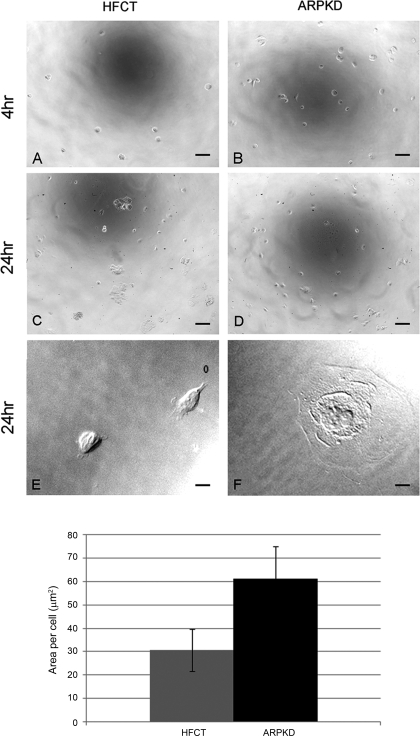
Fig. 6.
Time-dependent attachment and spreading of ARPKD cells by comparison to normal HFCT cells. A–F: phase contrast microscopy 4 h (A and B) and 24 h (C–F) after attachment; 2,000 cells per collagen-coated well. More ARPKD than HFCT cells attached. An ARPKD cell (F) was more spread than 2 HFCT cells (E; ×63 objective). Scale bar represents 6 μm. Bar graph: quantitation of area values in HFCT and ARPKD cells after 24 h adhesion to collagen I. Image J analysis software; n = 3; 4 replicates per condition; 20 cells.

