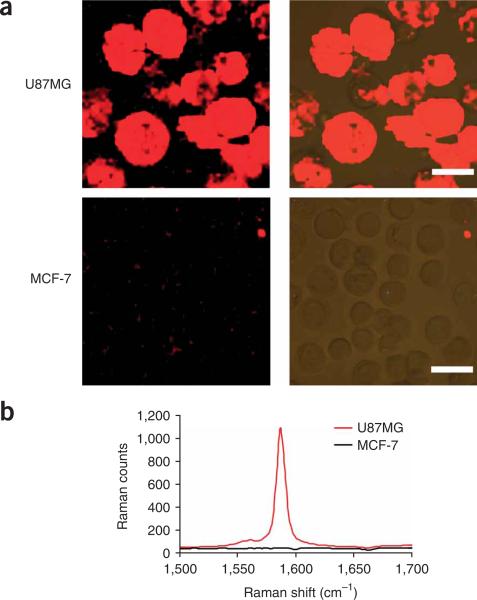
Figure 6.
Targeting SWNT bioconjugates for cell labeling and Raman imaging. Confocal Raman images of U87MG (integrin αvβ3-positive) and MCF-7 (integrin αvβ3-negative) cells (left column) after incubation with SWNT–RGD for 1 h at 4 °C (a). Optical images overlaid with Raman images are shown in the right column. Scale bar = 20 mm. (b) Averaged spectra of two Raman images in panel (a). Very strong Raman G-band signals are observed on U87MG cells. Negative MCF-7 cells exhibit minimal nonspecific absorption signals of SWNT-RGD. This figure is adapted from previously published work14.

