
Figure 2.
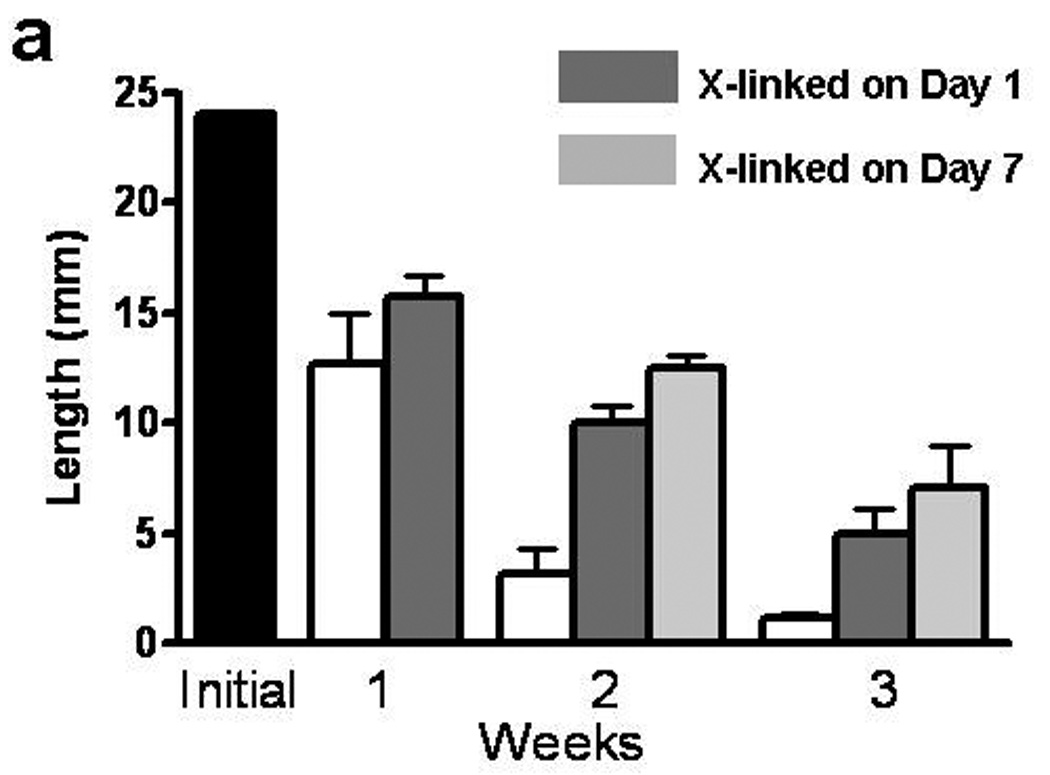
Cross-linking effects on TC compaction. The black bar represents the initial length of TC. White (non-cross-linked control) and shaded grey bars (cross-linked) represent the measured length of TC at weekly time points for the 3 weeks of culture.