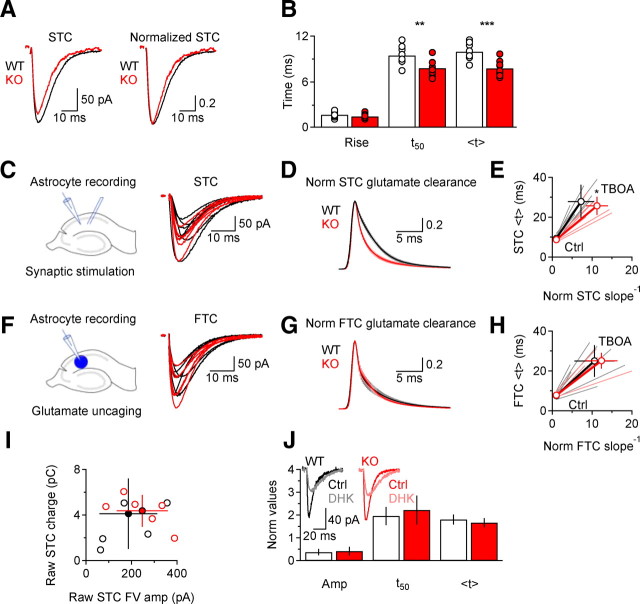
Figure 1.
Deleting EAAC1 does not alter the glial uptake capacity, but speeds the time course of synaptically released glutamate clearance. A, Examples of raw and peak normalized STCs in WT (black) and KO mice (red). Each trace represents the averages of 20 trials. B, The bar chart shows the summary of the kinetic properties of STCs in WT (white) and KO mice (red). STCs decay faster in the absence of EAAC1 (rise time, p = 0.17; t50 **p = 0.002; <t ***p = 0.0002; WT n = 8, KO n = 13). C, Left: schematic of the experimental design. Electrical stimuli were delivered through a bipolar electrode in stratum radiatum to evoke glutamate release from Schaffer collateral fibers. Right: Raw WT (black) and KO (red) STCs. D, Deconvolution-derived clearance of synaptically released glutamate is faster in KO mice (*p = 0.02). Mean ± SEM. E, The STC clearance derived from centroid analysis is also faster in KO mice (*p = 0.02). F, Left: Schematic of the experimental design. MNI-l-glutamate (100 μm) was uncaged over the entire field of view. Right: Raw WT and KO FTCs. G, Deconvolution-derived clearance of caged glutamate is similar in WT and KO mice (p = 0.61). H, The FTC clearance derived from centroid analysis is similar in WT and KO mice (p = 0.29). Data in C–H have been obtained from the same population of astrocytes (WT n = 7, KO n = 6). I, Relationship between the STC charge transfer and the amplitude of the fiber volley preceding the STC. No difference in the extent of glutamate transport per afferent fiber recruitment is observed between WT and KO mice (WT n = 5, KO n = 6; raw STC charge p = 0.22; raw STC FV amplitude p = 0.42). J, STCs have a similar sensitivity to the GLT-1 antagonist DHK (300 μm) in WT (n = 5) and KO mice (n = 4, amplitude p = 0.71, t50
p = 0.47, <t
 p = 0.37). The inset shows representative examples of STCs recorded in control conditions and in the presence of DHK, in WT and KO mice.

