
Figure 6.
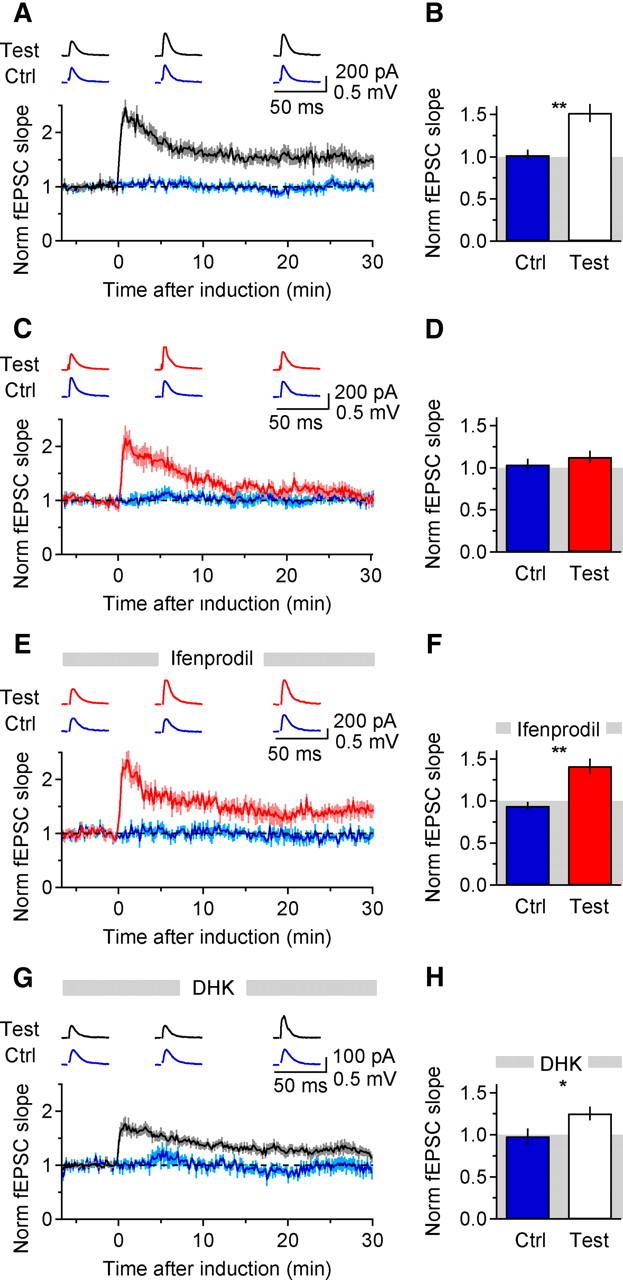
TBS-induced LTP is impaired in KO mice, but is rescued by ifenprodil. A, Time course of baseline-normalized fEPSC slope in WT slices (n = 9). Traces at the top are average responses in test and control pathways 5–0 min before, and 5–10 min and 25–30 min after TBS. The induction protocol consisted of 5 bursts at 5 Hz (100 Hz and 0.06 s each). B, Summarized effect of TBS on fEPSC slope in control and test pathways (WT Ctrl-Test **p = 0.001). C, Same as in A, in KO mice (n = 7). D, As in B, in KO mice (KO Ctrl-Test p = 0.45; WT Test-KO Test *p = 0.013). E, As in A, in KO mice and in the presence of ifenprodil (5 μm; n = 6). F, As in B, in KO mice and in the presence of ifenprodil (KO Ctrl-Test **p = 0.003; KO Test-KO Test ifenprodil *p = 0.029; WT Test-KO Test ifenprodil p = 0.50). All data in this figure represent mean ± SEM. G, Time course of baseline-normalized fEPSC slope in WT slices (n = 13) in the presence of DHK (15 μm). H, Summarized effect of TBS on fEPSC slope in control and test pathways (WT DHK Ctrl-Test *p = 0.016).