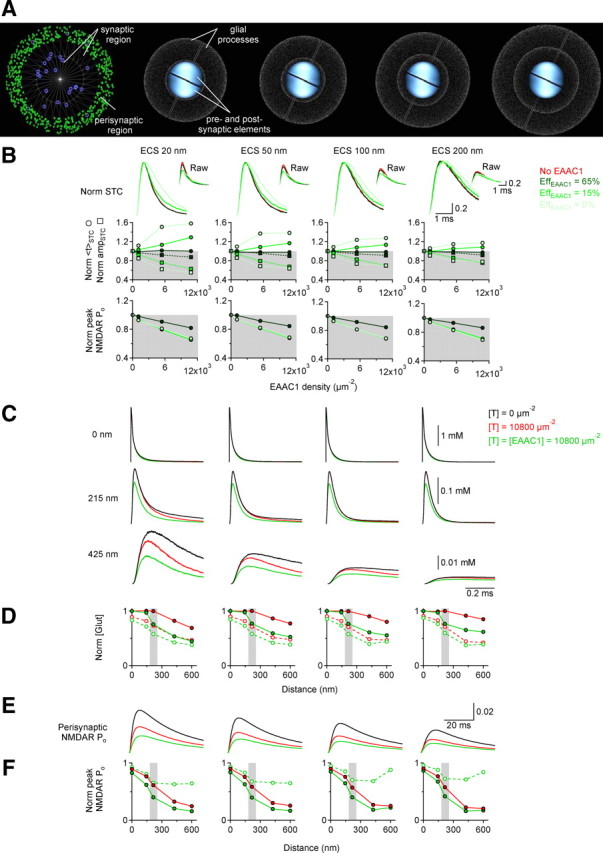
Figure 9.

Three-dimensional Monte Carlo model of the synaptic and extrasynaptic environment. A, The first diagram illustrates the arrangement of NMDARs (blue symbols) and EAAC1 molecules (green symbols) in the postsynaptic area directly facing the presynaptic terminal (r = 250 nm). The PSD is the inner white circle (r = 110 nm) and the perisynaptic area the 70-nm-wide ring at the edge of the apposition zone. NMDARs are randomly scattered in the PSD at d = 300 μm−2, and at d = 60 μm−2 beyond the PSD. In this example, for EAAC1, d = 1080 μm−2. The next images show the arrangement of the presynaptic and postsynaptic elements and of neighboring astrocytic processes (wedges). The ECS width between the synapse and the wedges is 20 nm, 50 nm, 100 nm, 200 nm, respectively. The white dots represent glial glutamate transporters, present at d = 10,800 μm−2. At t = 0, 2000 glutamate molecules were released from a point source 20 nm above the center of the PSD (see Materials and Methods for details). B, Top: The four panels show the simulated astrocytic STCs obtained at the different values of ECS width described in A. The red traces represent simulated STCs obtained in the absence of EAAC1. The green traces represent simulated STCs obtained in the presence of perisynaptic EAAC1 (d = 10,800 μm−2), for different levels of efficiency of glutamate transport (dark green, EAAC1 efficiency = 65%, like that of glial transporters; green, EAAC1 efficiency = 15%; light green, EAAC1 efficiency = 0%). The insets display STC profiles, normalized by that observed in 20 nm ECS width, with no glial or neuronal transporters. Middle: Summary results of the influence on <t STC (filled circles and continuous lines) and ampSTC (filled squares and dotted lines) of varying the density of expression of EAAC1, its transport efficiency, and the width of ECS around an active synapse. Bottom: Effect of varying EAAC1's transport efficiency on perisynaptic NMDAR activation. C, Effect of glial transporters and EAAC1 (efficiency = 15%) on the glutamate concentration profile monitored in the extracellular volume above the PSD (0 nm), the perisynaptic ring (215 nm), and a 100-nm-wide extrasynaptic region centered 425 nm away from the center of the PSD (425 nm). The concentration of glial transporters ([T]) is set to 10,800 μm−2. The concentration of EAAC1 ([EAAC1]) is set to 0 μm−2 in the black and red traces, whereas it matches the one of glial transporters (10,800 μm−2) in the green traces (both glial and neuronal transporters are present in these simulations). Glial transporters curtail the decay of the glutamate transient within the synapse, and also decrease the peak glutamate concentration extrasynaptically. EAAC1 decreases the peak but, due to its low transport efficiency, prolongs the decay of the glutamate transient in perisynaptic and extrasynaptic regions. D, Summary of the effects of glial transporters (red) and EAAC1 (green) on the peak (solid lines) and the integral (dashed lines) of the glutamate concentration at different distances from the release site. The gray shaded area represents the region in which EAAC1 is expressed. E, Example traces showing the effect of glial and glutamate transporters on the activation of perisynaptic NMDARs. F, Summary of the effects of glial transporters (red) and EAAC1 (green) on the peak open probability of NMDARs at increasing distances from the release site, for different values of ECS width. The dashed line represents the relative effect of EAAC1 compared with what measured in the presence of glial transporters only. EAAC1 limits NMDAR activation particularly in the perisynaptic region. The level to which this effect extends in the extrasynaptic compartment depends on the ECS width.
