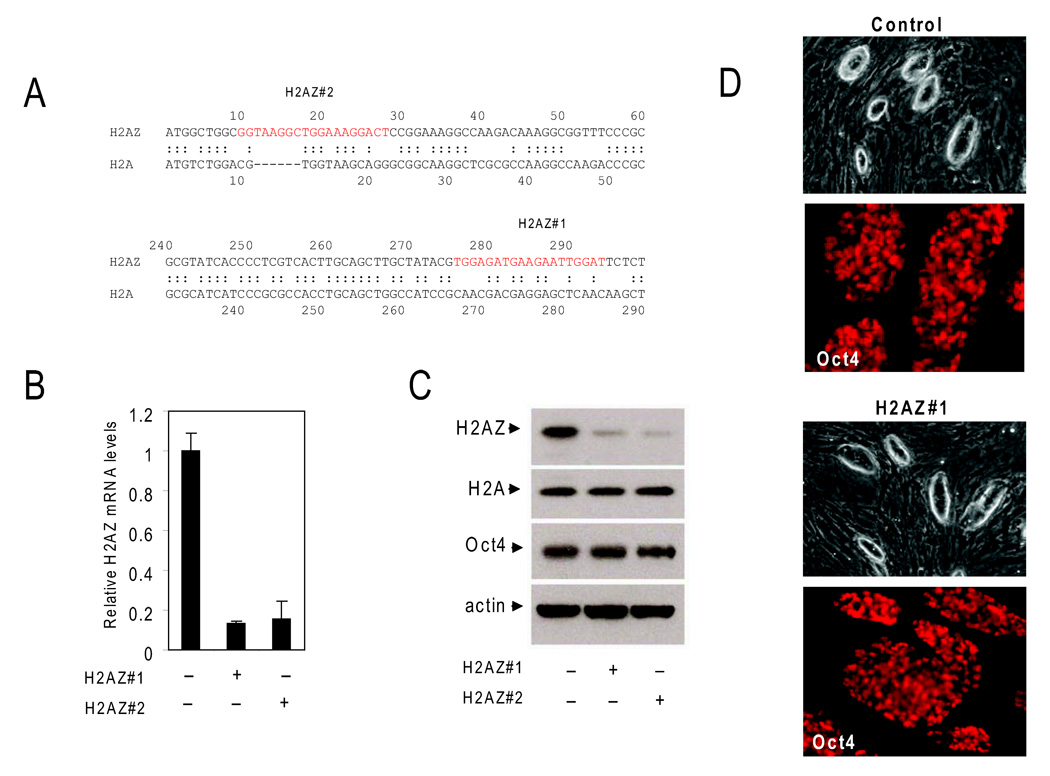
Figure 4. RNAi-mediated H2AZ depletion in ES cells.
(A) Schematic representation of H2AZ hairpin targeting sequences (red) and the homology between H2A and H2AZ. (B) mRNA levels were significantly reduced upon RNAi-mediated suppression of H2AZ as measured by quantitative real-time PCR in H2AZ-depleted ES cell lines relative to the control ES cell line. Data were normalized to Gapdh and error bars represent 2 standard deviations. (C) H2AZ protein abundance s determined by Immunoblot analysis is specifically reduced in depleted ES cell lines whereas no reduction in histone H2A or Oct4 levels is observed in the control cell line. Actin serves as a loading control. (D) ES cell colony morphology and Oct4 levels are similar between control and H2AZ-deficient ES cell lines.

