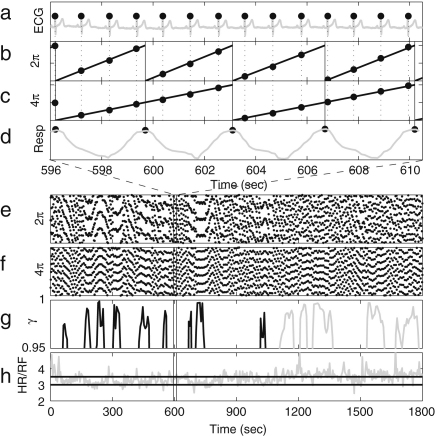
Fig. 31.
Construction of a cardio-respiratory synchrogram. (a) An ECG signal during a short time segment with its R-peaks marked by small filled circles. (b) The phases (mod ) of the respiration signal shown in (d) at the marked R-peaks times in (a) during the time segment. (c) The phases (mod ) of the respiration signal shown in (d) at the marked R-peaks times in (a) during the time segment. (d) The respiratory signal during the time segment, with its maxima marked. (e) A synchrogram for 1: synchronization during the whole measurement period. (f) A synchrogram for 2: synchronization during the whole measurement period. (g) Synchronization indices above 0.95 during the whole measurement period, where the black line represents 1:3 and the grey line represents 2:7 synchronization. (h) The ratio between HRV and RFV during the whole measurement period, where the two lines lie at the ratios 3.0 and 3.5, corresponding to 1:3 and 2:7 synchronization. All are calculated from the same data, as shown in Fig. 2.

