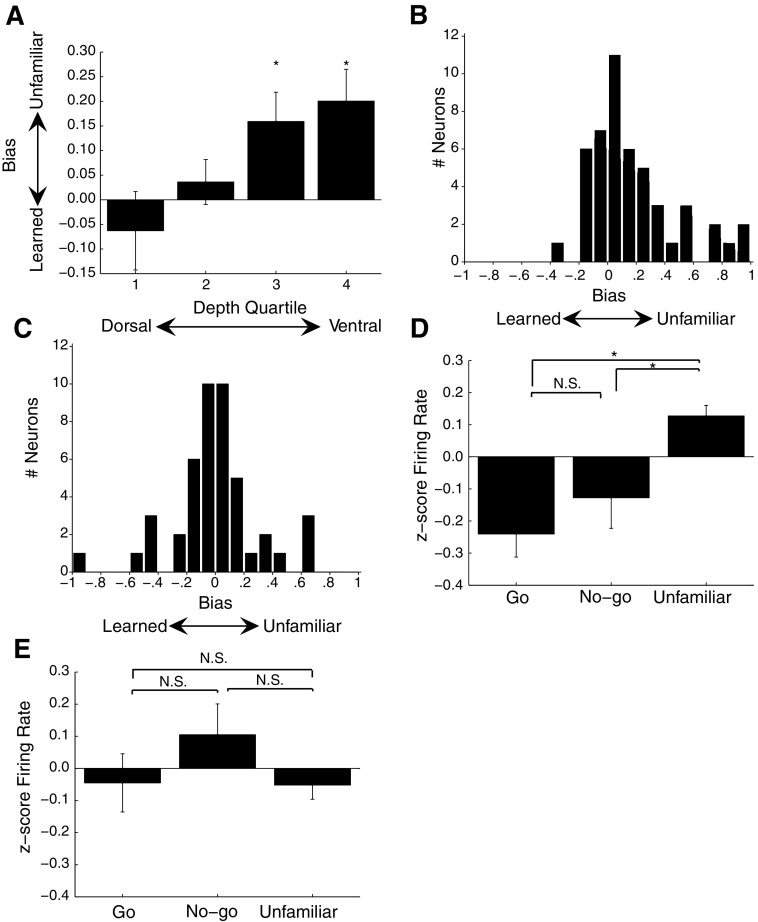
Fig. 5.
Preference for unfamiliar songs in NCM neurons. A: bar graph showing the bias values for neurons from different depth quartiles. The range of the quartiles from dorsal to ventral was 1,090–1,870 (n = 21), 1,871–2,580 (n = 24), 2,581–3,065 (n = 24), and 3,066–4,091 μm (n = 24), measured from the surface of the brain. *Bias values significantly different from 0. B: distribution of bias values for 48 ventral NCM neurons. Bias values >0 indicate neurons that responded higher to unfamiliar songs, whereas bias values <0 indicate neurons that responded higher to learned songs. C: distribution of bias values for 45 dorsal NCM neurons. D: bar graph showing the z-scores of the firing rates to the Go, No-go, and unfamiliar songs for 48 ventral NCM neurons. E: bar graph showing the z-scores of the firing rates to the Go, No-go, and unfamiliar songs for 45 dorsal NCM neurons. *P < 0.05. NS, P > 0.05. Error bars show SE.

