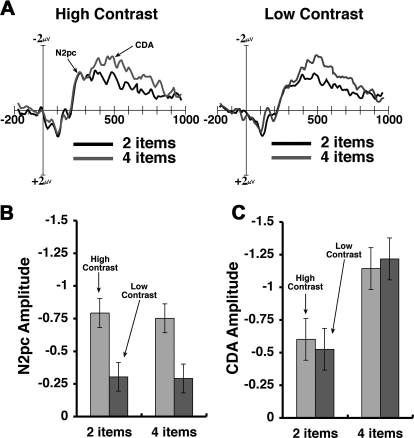
Fig. 3.
Difference wave averaged across 3 channels shown in Fig. 2. A: averaged difference wave across time for high (left) and low (right) contrast conditions. Set size 2 and 4 are shown in black and blue, respectively. In both contrast conditions, N2pc followed by contralateral delay activity (CDA) are visible. B: N2pc amplitude in the time window between 200 and 280 ms after the memory array onset. Error bars = 95% confidence intervals. Notice there is a significant difference between contrasts (P < 0.001) but not between set sizes. C: CDA amplitude in the time window between 300 and 900 ms after the memory array onset. There is a significant difference between set sizes (P < 0.02) but not between contrasts.

