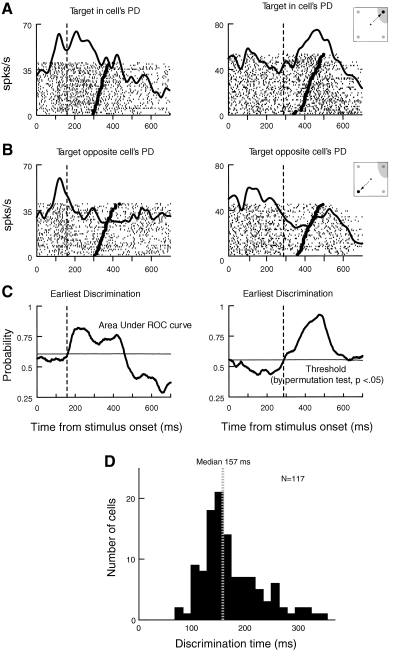
Fig. 3.
Target/distractor discrimination. In A–C, each column represents results from an individual PMd neuron. The vertical dashed lines show target/distractor discrimination time [the time at which receiver operating characteristic (ROC) area 1st reliably crosses the statistical threshold of P < 0.05]. A: activity of PMd cells aligned on stimulus onset when the target was in the PD. B: activity of the same cells when the target was in the opposite direction. C: ROC analysis of target/distractor discrimination. The thick lines indicate the area under the ROC curve as a function of time from stimulus onset. The thin horizontal lines indicate the P < 0.05 statistical threshold generated at each time point using a permutation test. D: distribution of discrimination times observed in PMd.

