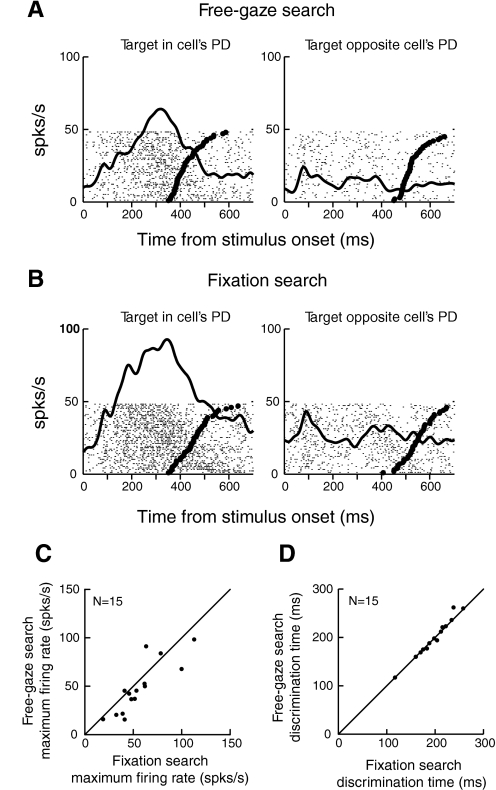
Fig. 4.
Comparison of PMd activity in free-gaze and fixation search. A: neural activity aligned on stimulus onset in free-gaze search. B: activity of the same cell aligned on stimulus onset in fixation search. In A and B, the left column represents neural activity when the target was in the cell's PD, whereas the right column represents activity when the target was in the opposite direction. C: comparison of maximum firing rates in fixation and free-gaze search. D: comparison of discrimination time in fixation and free-gaze search.

