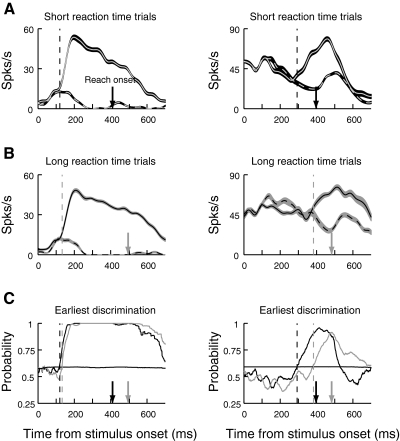
Fig. 5.
Target/distractor discrimination for the short and long reaction time groups. Neural activity is aligned on the onset of the stimulus array, and each column in the figure shows data from a single neuron. Black corresponds to the short reaction time group and gray corresponds to the long reaction time group. The arrows on the abscissas represent the mean reach reaction time for each group. The vertical dashed lines show discrimination time for the corresponding groups. A: neural activity for the short reaction time group. B: activity of the same cells for the long reaction time group. In A and B, mean ± SE firing rates are plotted. The solid line represents activity when the target was in the cell's PD, and the dotted line represents activity when the target was in the opposite direction. C: ROC analysis of target/distractor discrimination. The thick lines show area under the ROC curve as a function of time from stimulus onset for both short (black) and long (gray) reaction time groups. In the cell on the left, ROC area 1st reliably crosses the threshold at about the same time regardless of reaction time, indicating that discrimination in this neuron is not correlated with reaction time. However, in the cell on the right, discrimination occurs proportionally later for the longer reaction time group.

