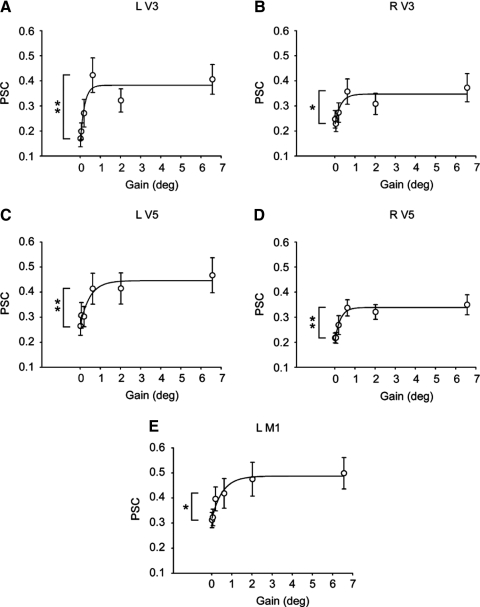
Fig. 4.
A–E: region of interest (ROI) analyses from visuomotor areas that change with a large change in force error. Regression results and post hoc t-test for all visuomotor areas are shown in Table 1. Individual graphs show brain areas that had increased BOLD activation between gain level 1 and gain level 4. Each data point represents the across participant mean at each level of visual gain. Error bars represent ±1SE. L, left, R, right. **P < 0.01; *P < 0.05.

