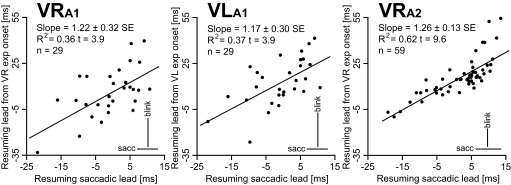
Fig. 10.
Comparison between saccadic and eye vertical drift resumption leads. For each cell, the average saccadic resumption lead is plotted on the x-axis and the average resumption lead of the vertical exponential drift on the y-axis. A positive value means that the OPN resumed its firing before saccadic offset and before the onset of the exponential drift of the vertical eye transient, respectively. VRA1 illustrates the right eye data for the 29 cells from animal A1 for which we have data and VLA1 the left eye data. VRA2 reports the right eye data for the 59 cells from animal A2 for which we have data. We have no data for the left eye. The bars on the bottom right corners report the average of the SDs of the resumption lead subsets, as indicators of the between-trial scatter of the data. The results of the linear regression are reported on the top left corners of the plots. Cells that resumed their firing later with respect to saccadic offset also resumed their firing later with respect to the onset of the vertical eye drifts and vice versa.

