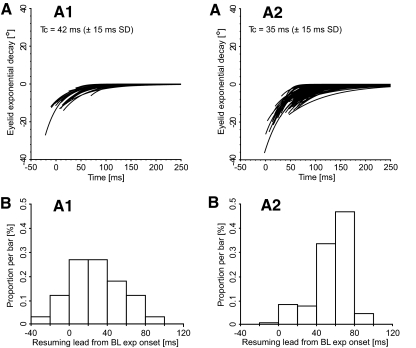
Fig. 6.
Eyelid exponential drifts: single trials. AA1 illustrates, for the blinks (n = 34) of a cell data set from animal A1, the exponential fits of the eyelid position drifts, as defined in methods. AA2 illustrates the fits for the blinks (n = 160) of a cell data set from animal A2. Both trigeminal and spontaneous blinks are included and only the trials with a clear breaking point in the eyelid velocity dynamics (56 and 63% of all eyelid traces, respectively) are reported. The traces are synchronized with respect to the first resumption spike after the pause. The default value (t → ∞) of the exponentials is artificially set to zero for clarity. The bottom panels are the distribution histograms of the associated resumption lead values. Positive values indicate that the onset of the exponential drifts followed the first resumption spike of the cell. Tc is the time constant average (±SD) of the exponential drifts.

