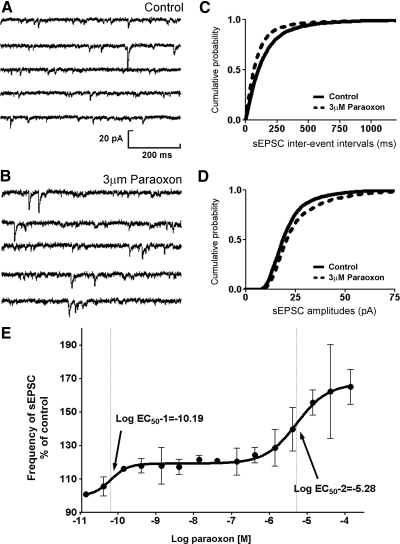
Fig. 1.
Paraoxon enhanced the frequency and amplitude of spontaneous excitatory postsynaptic currents (sEPSCs). A and B: representative sEPSC recordings obtained from dentate granule cells before (control) and after application of 3 μM paraoxon (PXN). C and D: cumulative probability plots of sEPSC frequency (C) and amplitude (D) obtained by pooling data from 8 neurons before (—) and after (- - -) application of paraoxon. E: relationship of paraoxon concentration to sEPSC frequency. The ordinate depicts frequency of sEPSCs in the presence of paraoxon expressed as the percent fraction of that before paraoxon application. •, mean frequency; 3–8 neurons were tested at each concentration. The solid line, the best fit of the concentration response relationship to a biphasic sigmoidal function.

