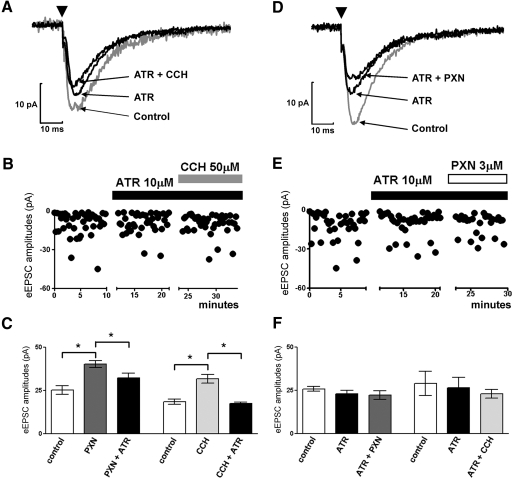
Fig. 7.
Atropine blocked both carbachol- and paraoxon-induced increase in eEPSC amplitudes. A: representative average trace of eEPSC at baseline (gray) followed by application of atropine and co-application of atropine and carbachol. Arrowheads in this and D indicate the application of stimulus. B: representative time-scaled amplitude of peak eEPSCs recorded from a cell before and after application of atropine followed by co-application with carbachol. C: quantification of eEPSC amplitudes demonstrated that carbachol- or paraoxon-induced increase in eEPSC amplitudes was reversed by co-application of atropine. D: the averaged eEPSC trace at baseline (gray) followed by application of atropine and co-application of atropine and paraoxon. E: representative time scaled amplitude of peak eEPSCs recorded from a cell before and after application of atropine and then followed by co-application with carbachol or paraoxon. F: quantification of eEPSC amplitudes demonstrated that preapplication of atropine occluded the effect of carbachol and paraoxon on eEPSC amplitudes.

