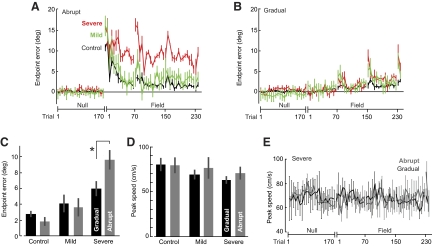
Fig. 2.
Performance during the adaptation block. A and B: angular error at the end of the movement (means ± SE) for each group during abrupt and gradual training. Set breaks are indicated by the numbered tick marks on the x-axis. Bin size is 2 trials for the trials immediately following set break and 6 trials for the remainder of the block. C: average angular error at the end of the movement (means ± SE) during the last 6 field trials when the force field was at full strength in both the abrupt and gradual conditions. Control and mild patients perform comparably in the 2 conditions. Severe patients showed an improvement in performance in the gradual condition. D: average peak speed (means ± SE) during the last 6 trials when the field was at full strength in both the abrupt and the gradual conditions. E: average peak speed (means ± SE) for the severe patients during abrupt and gradual training. Bin size is 2 trials for the trials immediately following set break and 6 trials for the remainder of the block.

