Fig. 2.
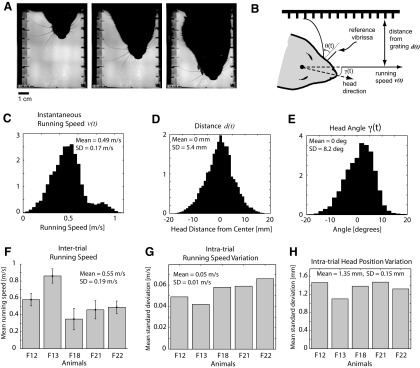
Behavioral variability. A: 3 frames of the high-speed video, separated by 25 ms each. See the accompanying movie file in the Supporting Information (RatMovie.mov) for the complete sequence. B: geometry of measured parameters. Base angle of vibrissa θ(t) is measured with respect to reference vibrissa that is not in contact with the grating. Velocity of head v(t) and distance of head from grating d(t) are measured using head-tracking reflections. C: histogram of instantaneous velocities, across all trials and all animals (×104). D: histogram of instantaneous distance from head to wall, across all trials and all animals (×104). E: histogram of instantaneous head angle (in degrees), across all trials and all animals (×104). F: mean running speed for each animal. Error bars denote SE. F12–F22 are animal identifiers. G: mean (SD) across trials for each animal. H: mean (SD) in head position within a trial, for each animal.

