Fig. 5.
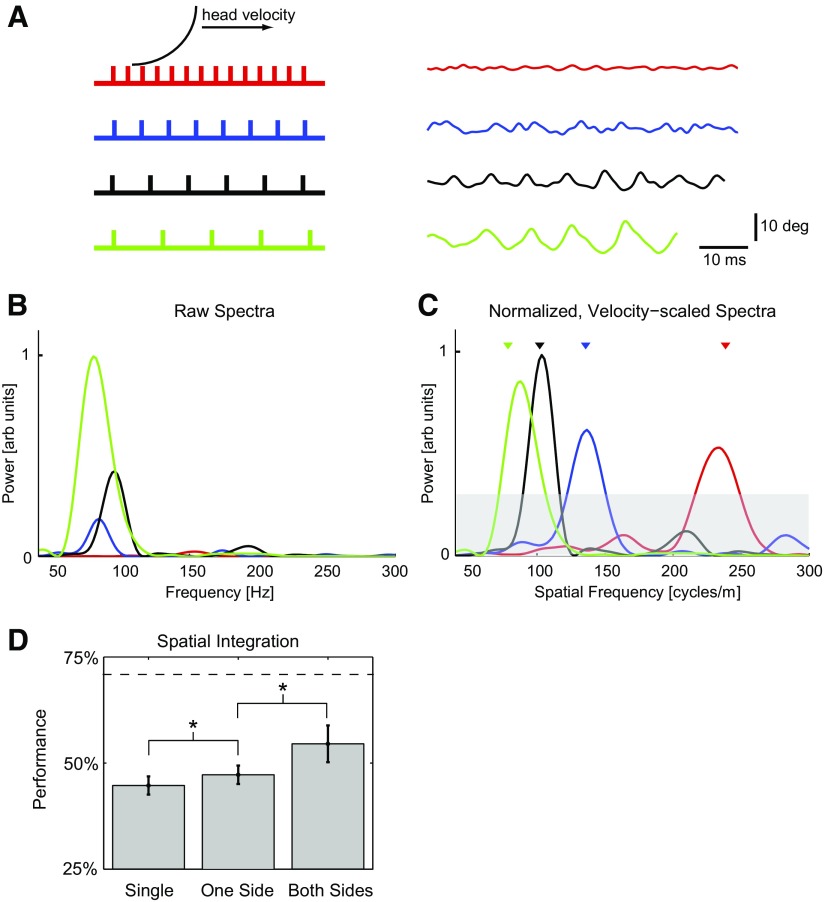
Spectral content of high-frequency component of vibrissae signals can be used to classify gratings. A: left: schematic showing vibrissa interacting with gratings 1–4 (gratings scaled correctly with respect to each other). Right: example high-frequency components of angular displacement signal from all 4 gratings for vibrissa C2. Average head speeds during these trials were 0.66, 0.62, 0.92, and 0.92 m/s, respectively. B: power spectra of signals in A, showing variation of total power and spectral peak with grating (arbitrary units, scaled to max of 1). Note that peaks are not easily discriminable. C: normalized, velocity-scaled power spectra of signals in A, showing clear separation of spectral peaks in the spatial frequency domain (arbitrary units, scaled to max of 1). Triangles show location of spatial frequency of the gratings. Gray band represents upper bound of 95% CI on signals of similar length with no significant spectral structure. Peaks emerging from this band are thus judged statistically significant. D: performance of classification algorithm using peak of spectrum is significantly above chance. In addition, spatial integration [across different vibrissae on one side of the face (One Side) and across both sides of the face (Both Sides) during a single trial] significantly improves performance. *, statistically significant difference at the level of P < 0.05.

