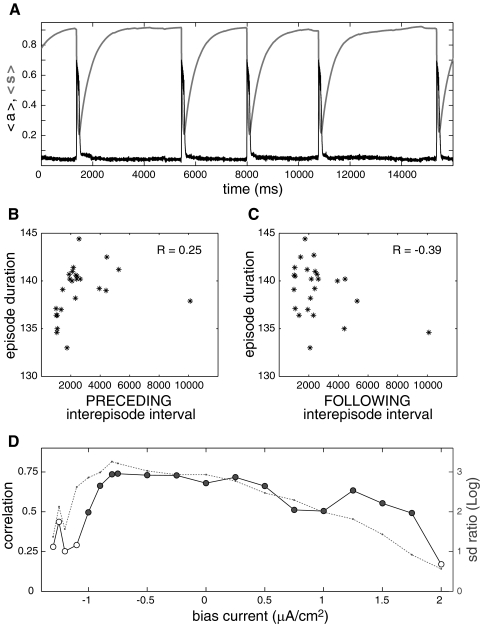
Fig. 6.
Dependence of the correlation pattern on cell excitability. A: time course of activity (〈a〉, black) and recovery from depression (〈s〉, thick light green) for a network of 100 HH neurons with all-to-all coupling and synaptic depression. Input currents to the neurons are uniformly distributed on the interval [−10, 5], and an additional bias current of −1.2 μA/cm2 is applied to all cells of the network. Note that episodes occur after random amounts of time once 〈s〉 has reached its maximal value. B: absence of correlation between episode duration and preceding interepisode interval. C: absence of correlation between episode duration and following interepisode interval. D: correlation coefficient between episode duration and preceding interepisode interval (circles, black line) and variability of 〈s〉 at episode onset relative to variability at episode termination (dotted green line), plotted as a function of the bias current. The relative variability is measured as the log of the ratio of the SD of 〈s〉 at onset and at termination. For the most negative bias currents (≤ −1 μA/cm2), the correlation is not significant because the variability of 〈s〉 at episode onset is low. As the variability at onset increases, the correlation between episode duration and interepisode interval becomes significant and remains high until higher values of bias current lead to lower relative variability of 〈s〉 at episode onset.

