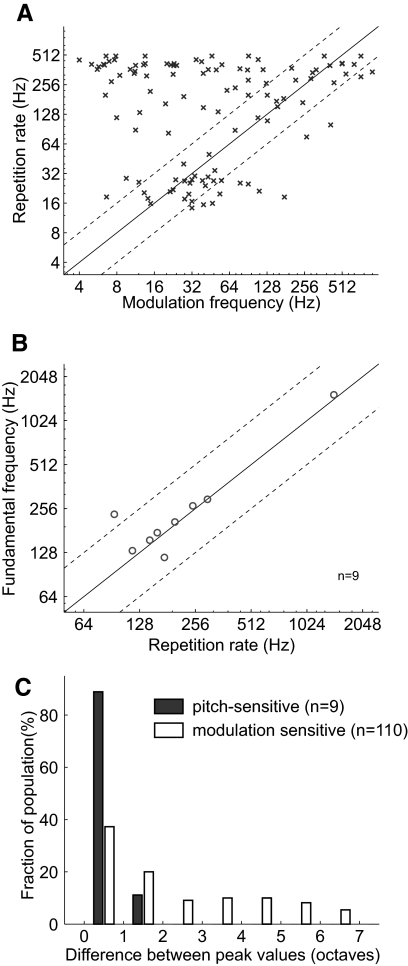
Fig. 11.
Similarity in repetition rate tuning for 2 acoustic signals. A: comparison of the weighted best modulation frequency (sAM tones) and weighted best repetition rate (acoustic pulse trains) for individual neurons within auditory cortex. The correlation was not statistically significant (Spearman correlation coefficient, r = −0.0091, P = 0.9252). The solid diagonal line indicates where y = x. The dashed diagonal lines indicate the 1 octave boundaries surrounding the y = x line. B: comparison of the weighted best fundamental frequency (missing fundamental complex tones) and weighted best repetition rate (sAM tone or acoustic pulse trains) for individual pitch-selective neurons. The correlation did reach statistical significance (Spearman correlation coefficient, r = 0.65, P = 0.067). C: a histogram of the absolute difference in peak values for repetition rate tuning in the 2 acoustic stimuli used in A and B. Pitch-selective neurons have a more similar best repetition rate for 2 spectrally different acoustic stimuli (Wilcoxon rank sum test, P < 2.0 × 10⁻⁴).

