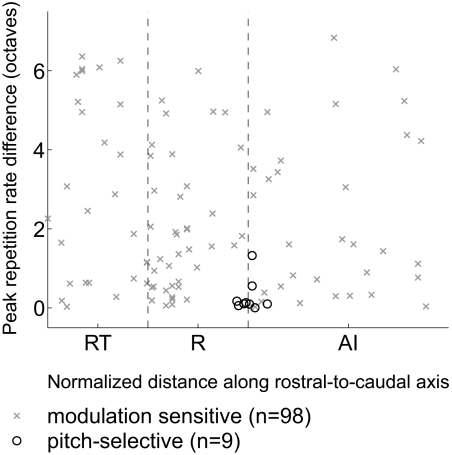
Fig. 12.
Topographic distribution of repetition rate tuning similarity. Peak repetition rate difference (from Fig. 11) of modulation sensitive and pitch-selective neurons plotted according to their position along the rostrocaudal axis of auditory cortex (in normalized coordinates). The dashed vertical lines indicate the boundaries between AI/R and R/RT.

