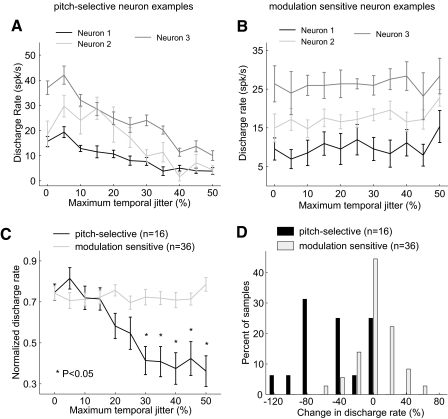
Fig. 14.
Comparison of sensitivity to temporal irregularity between pitch-selective and modulation sensitive neurons. A: individual examples of regular and irregular pulse train responses in pitch-selective neurons. Neuron 1 (unit M32Q-101.1, rectangular clicks), neuron 2 (unit M41O-276.1, acoustic pulse train with tone carrier), neuron 3 (unit M36N-523.1, acoustic pulse train with noise carrier). B: individual examples of regular and irregular pulse train responses in modulation sensitive neurons: neuron 1 (unit M2P-357.2, field RT), neuron 2 (unit M32Q-117.1, field R), neuron 3 (unit M36N-418.1, field AI). C: normalized tuning in pitch-selective and modulation sensitive neurons to acoustic pulse trains varying in temporal irregularity. For pitch-selective neurons, normalized responses for all jitter values significantly different from regular click trains (P < 0.05 Bonferonni corrected, Wilcoxon rank sum test) are indicated (*). Normalized responses of modulation sensitive neurons to irregular acoustic pulse trains were not significantly different from regular acoustic pulse trains. D: a comparison between pitch-selective and modulation sensitive neurons in their interpolated percent change in discharge rate between a regular and irregular (50% jitter) acoustic pulse train. The 2 distributions are significantly different (P < 3.6× 10⁻⁵, Wilcoxon rank sum test).

