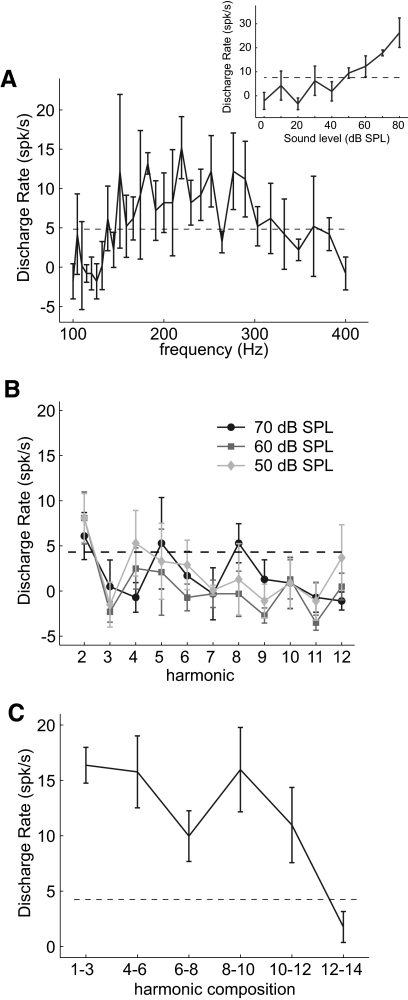
Fig. 5.
Pitch-selectivity criteria in an example pitch-selective neuron. All data are shown is from unit M2P-157.1. Error bars in A–C indicate the SE. A: frequency tuning curve for tones played at 50 dB SPL. Inset: a rate-level response at best frequency. B: response to harmonics of the best fundamental frequency (182 Hz) played individually at 0, +10, and +20 dB above the sound level threshold at the best frequency. C: response to harmonic complex tones (each harmonic is played at 50 dB SPL). All acoustic stimuli are missing the fundamental frequency except for the acoustic stimulus composed of harmonics 1–3.

