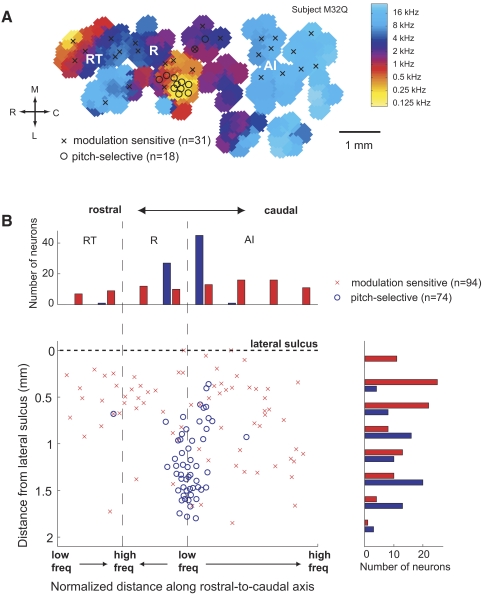
Fig. 9.
Spatial distribution of pitch-selective and modulation sensitive neurons. A: frequency map from 1 subject (M32Q-left hemisphere) with the location of pitch-selective neurons and modulation sensitive neurons indicated. B: normalized cortical map of locations of pitch-selective and modulation sensitive neurons across four subjects (4 hemispheres).

