Fig. 1.
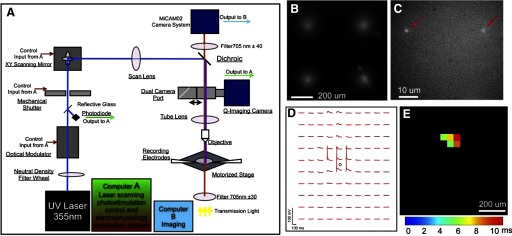
The system design, calibrations, and tests for combining laser scanning photostimulation with voltage-sensitive dye (VSD) imaging. A: the system diagram of a laser scanning photostimulation and VSD imaging setup. B: the physical calibration measurement of the laser scanning photostimulation system with a 2 × 2 (spacing at 500 μm) uncaging pattern generated by single 100 μs laser pulses (32 mW) on a thin layer of 0.2% caged fluorescein dextran through a 4× objective. C: the result of fluorescein uncaging by 10-μs laser pulses (32 mW) using a 60× objective. Red arrows point to fluorescent spots resulting from uncaging. We estimated the laser physical excitation size with the full width at the half height (FWHH) from the cross profile of the uncaging spot with the height referring to fluorescence intensity. D and E: the functional calibration of laser scanning photostimulation by measurement of a single neuron's excitation profile. The pyramidal neuron in visual cortex (V1) layer 4 was recorded in whole cell patch-clamp configuration and photostimulated with 1-ms laser pulses (32 mW). The array of 16 × 16 stimulation sites spanned different V1 cortical layers, and the sites were spaced 50 μm apart. D: the neuronal response traces depicting changes in the membrane potential in response to photostimulation at the 10 × 10 stimulation sites centered at the recorded cell (indicated by the small black circle). Note that suprathreshold spikes were evoked only in the perisomatic region. E: the spiking locations of the neuron recorded in D across the 16 × 16 stimulation sites. The color code indicates latencies of spiking in response to stimulation at different locations (see the color bar).

