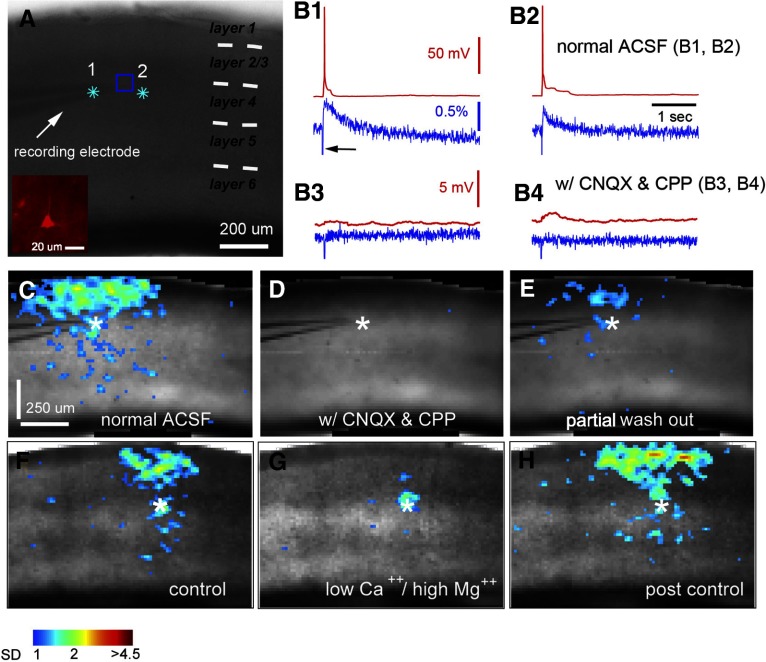
Fig. 2.
Characterization of VSD responses evoked by glutamate uncaging. A: grayscale image of V1 slice stained with NK3630, photostimulated (laser: 1 ms, 35 mW) at 2 sites (indicated by cyan stars) close to the recording electrode placed at the boundary of layers 3 and 4. As shown in the Inset, the recorded neuron was identified as an excitatory pyramidal neuron. B1 and B2: data traces of simultaneous whole cell recording and VSD imaging in response to photostimulation at sites 1 and 2 in normal artificial cerebrospinal fluid (ACSF), respectively. Red traces represent membrane potentials of the recorded neuron, and blue traces represent VSD signals that were measured from the region of interest (ROI) marked by a blue square around the electrode tip shown in A. The black arrow in B1 points to the artifact signal of laser excitation in the VSD signal trace. B3 and B4 show data traces of simultaneous whole cell recording and VSD imaging in response to photostimulation at the same sites as B1 and B2 but in ACSF with 10 μM CNQX and 10 μM 3-(2-carboxypiperazin-4-yl)-propyl-1-phosphonic acid (CPP). C–E: VSD image frames of peak activation after glutamate uncaging at site 1 (indicated by the white star) before and after bath application and after washout of CNQX and CPP, respectively. VSD signal amplitudes expressed as SD above the mean baseline signal are color coded. F–H: peak activation frames of a different V1 slice in response to laser photostimulation in a layer 4 site (indicated by the white star; laser: 1 ms, 35 mW) with perfusion of normal ACSF (control), low Ca2+ and high Mg2+ ACSF (containing 0.2 mM Ca2+, 4 mM Mg2+), and postcontrol normal ACSF, respectively. The data show that most VSD responses outside the photostimulation site are predominantly postsynaptic responses that are blocked in the low Ca2+ and high Mg2+ solution.

