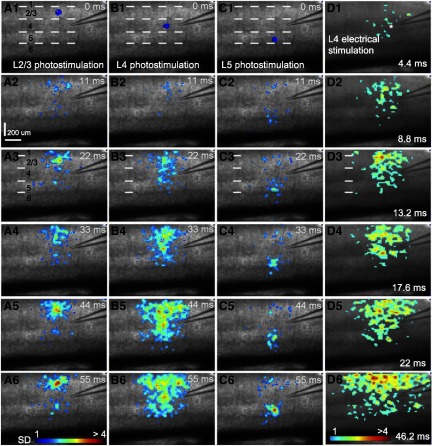
Fig. 3.
Spatially restricted neuronal activation via laser photostimulation enables high-resolution mapping of interlaminar connections in mouse V1 local circuits. A–C: sequences of VSD image frames in response to photostimulation (laser duration: 1 ms; power: 32 mW) at cortical layers 2/3, 4, or 5 in a V1 coronal slice, respectively, whereas D shows VSD image frames in response to electrical stimulation (1 ms, 50 μA current injection) through a microelectrode placed at V1 layer 4. VSD images were acquired at the rate of 2.2 ms/frame during the experiment and are displayed at specific intervals. Time progresses from top to bottom in the column, and color code is used to indicate VSD signal amplitudes expressed as SD above the mean baseline. The map pixels with amplitudes ≥1 SD are plotted and included for further quantification. Warmer colors indicate greater excitation. The displayed maps are from 1 trial without trial averaging, because single-trial VSD signals were of sufficiently high amplitudes in our study. The site of photostimulation can be identified by the laser excitation artifact (the blue spot) in the initial frames of the sequences. The short dashed white lines in the first image of A, B, and C denote the laminar boundaries of V1 layers 1, 2/3, 4, and 5 and 6. VSD images in D1–D6 are color coded differently from A–C. In D1, the white star indicates the tip of the glass pipette for current injections. Note that the CCD camera images have a slightly different aspect ratio. Under the 4× objective, the camera covers an area of 1.28 (w) × 1.07 (h) mm2, with a spatial resolution of 14.6 (w) × 17.9 (h) μm/pixel.

