
Fig. 3.
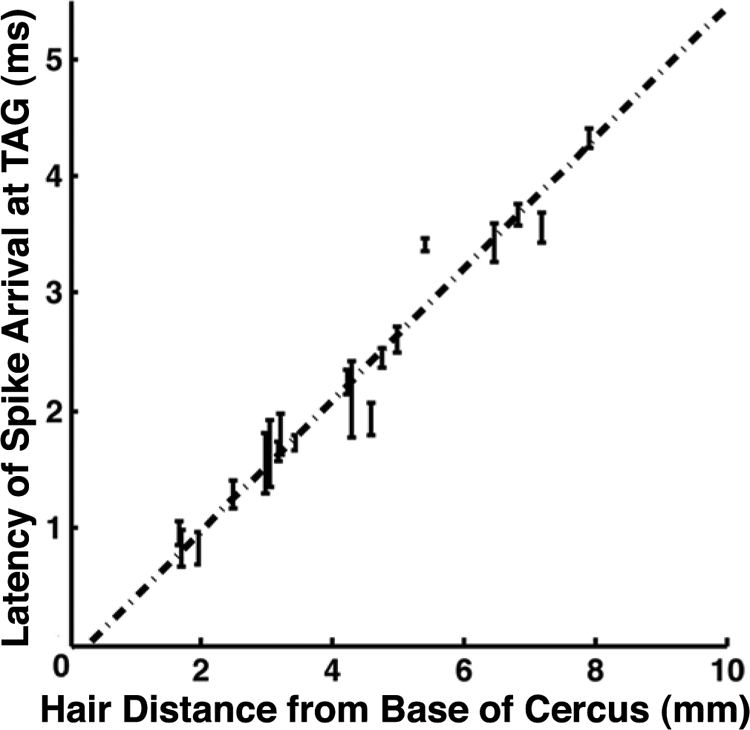
Linear dependence of spike propagation time on sensory afferent axon length. Each point on this graph is the spike propagation latency between the distal recording site and the base of the cercus for a single afferent axon, plotted against the distance between these 2 sites. Error bars show the SD of latencies measured for each hair. The dashed line is the best-fit linear regression for 23 hairs on 6 animals. The slope of the regression line measures the average axonal conduction velocity: 1.87 ± 0.09 mm/ms (R2 = 0.96, P < 0.001). This corresponds to a differential conduction delay of 0.54 ms/mm, or 5.4 ms over the length of a typical adult cercus.