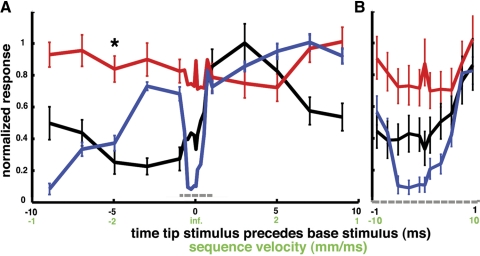
Fig. 6.
Differential behavior of INs to simulated wave fronts. A: the 3 plots show the responses of 3 INs to a set of multi-air-jet stimulus sequences presented at a variety of sweep speeds and directions. The 3 cells are the same as those described in Fig. 4 and the same color-coding is used. The ordinate is the mean number of elicited spikes (counted within 25 ms after stimulus termination) for 50 repeated presentations of the corresponding stimulus sequence, normalized by the spike count recorded for the stimulus sequence that yielded the maximal response. Error bars indicate 1SD around the mean. The abscissa indicates the speed with which the stimulus jets were swept along the cercus. Two different scales are presented for the abscissa. The black ordinate scale corresponds to the time between the first and last stimulus jets, with positive numbers indicating that the cercal tip was stimulated first (i.e., 0 corresponds to simultaneous presentation of the 4 pulses, positive values correspond to tip-to-base sweeps, and negative values correspond to base-to-tip sweeps; a total delay of +5 ms corresponds to the conduction velocity of the filiform afferents). The green scale translates these delays into simulated wavefront velocities. B: the range between 1-ms tip lead and 1-ms base lead for all 3 plots from A is displayed at an expanded ordinate scale, with error bars, for improved visibility.

