Fig. 8.
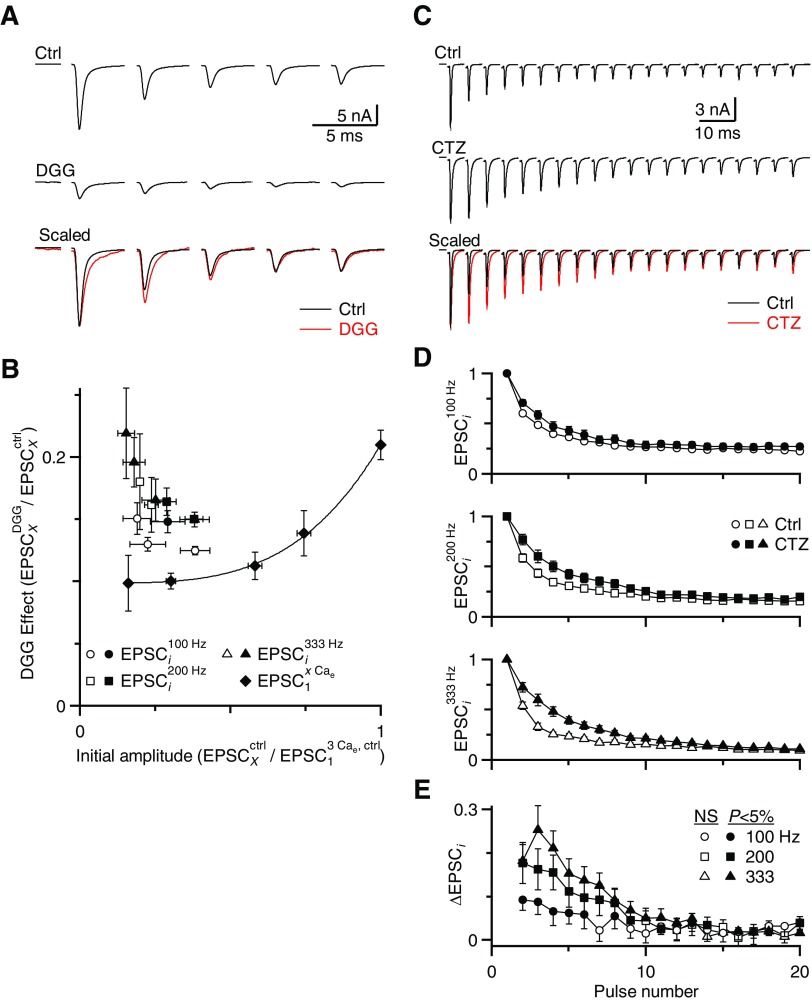
Desensitization persists during longer periods of activity. The presynaptic AN fiber was stimulated with trains of pulses in 1.5 Cae and the effects of DGG and CTZ were studied. A: EPSCs during 200-Hz trains for a representative experiment in control (top) and in DGG (middle). In the bottom panel, these traces are shown with EPSC1 amplitudes scaled to the same size. B: average data from 4 experiments are plotted similarly to Fig. 7. The line and solid symbols indicate the effects of DGG on EPSCs recorded in different Cae conditions (the saturation curve). Open symbols indicate the effect of DGG on EPSCs during 100-, 200-, and 333-Hz trains. The initial EPSC amplitude for the ith pulse in a train is given by EPSCixCae/EPSC13Cae and the effect of DGG is given by EPSCiDGG,xCae/EPSCiCtrl,xCae. The data for EPSC1 of the trains lie on the saturation curve, with later pulses extending toward the top left. Pulses that differed significantly from the saturation curve (P < 0.05) are plotted as filled symbols, indicating they showed significant desensitization. C: EPSCs during 200-Hz trains for a representative experiment in control (top) and in CTZ (middle). In the bottom panel, these traces are shown with EPSC1 amplitudes scaled to the same size. D: average changes in relative EPSC amplitude after CTZ application are shown over the course of 100-, 200-, and 333-Hz trains. This is calculated after normalizing to the first pulse in the train (analogous to ΔPPR in Figs. 2, 4, and 6). Points are averages of 11 or 12 cells from animals P16–P40. Filled symbols represent a significant increase in EPSC amplitude by CTZ at P < 0.05 (t-test).

