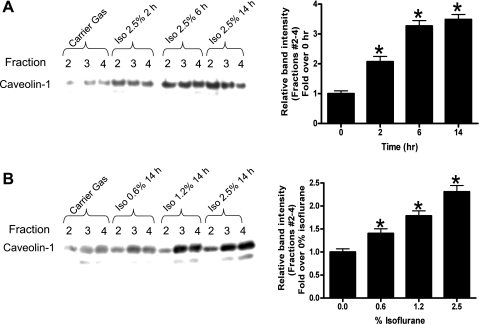
Fig. 3.
Isoflurane treatment causes time (2.5% for 2–14 h; A)- and dose (0–2.5% for 14 h; B)-dependent increases in caveolin-1 protein expression in SK1-HK-2 cells. Confluent SK1-HK-2 cells grown in 10-cm plate were processed for each experiment. Similar results obtained from 4 independent experiments. Densitometric quantifications of relative band intensities from buoyant fractions (layers 2–4) are also shown (n = 4, right of each panel). *P < 0.05 vs. carrier gas. Means ± SE.

