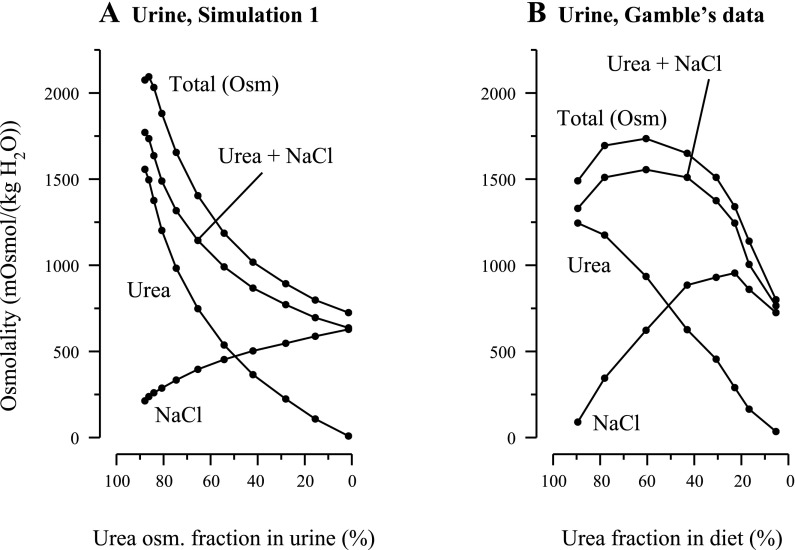
Fig. 1.
A: results for simulation 1: urine composition computed by mathematical model as a function of fractional contribution of urea to osmolality in urine. To represent a decreasing urea-to-salt ratio in a supplementary diet, the tubular fluid urea and NaCl concentrations at the outer medulla (OM)-inner medulla (IM) boundary were the only parameters that were modified [total osmolality collecting duct (CD) inflow boundary was fixed at a constant value; see details in main text]. B: experimental findings redrawn from Fig. 3 in study by Gamble et al. (12). Urea, portion of osmolality arising from urea; NaCl, portion of osmolality arising from NaCl; Urea+NaCl, portion of osmolality arising from urea and NaCl, taken together; Total (Osm), total osmolality arising from urea, NaCl, and nonreabsorbed solute. In the simulation, urine flow at maximum osmolality was 0.04492 nl·min−1·nephron−1 (stage 2). Urine flow for the corresponding experiment was not reported by Gamble et al. The results in A may be compared with the experimental findings in B and contrasted with the simulation results in Fig. 3B.

