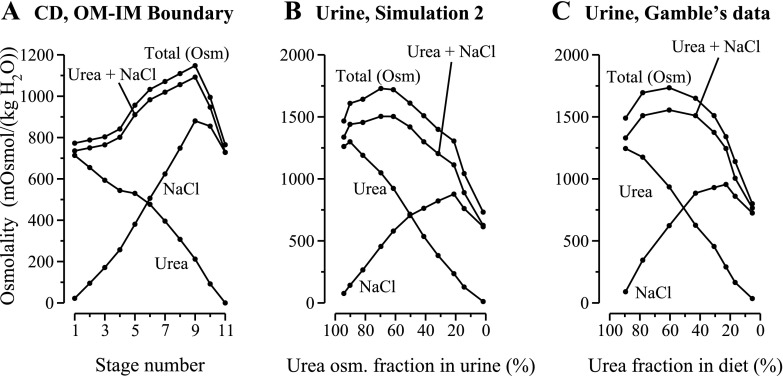
Fig. 3.
A: CD boundary conditions at the OM-IM boundary for simulation 2 as a function of stage number. B: results from simulation 2: urine composition computed by mathematical model for decreasing urea-to-salt ratio in supplementary diet; multiple parameters, in addition to CD boundary conditions, were modified as a function of stage number. C: experimental results redrawn from Fig. 3 in study by Gamble et al. (12) (same graph as in Fig. 1B). Terms are defined as in Fig. 1. In the simulation, urine flow at maximum osmolality (stage 4) was 0.11 nl·min−1·nephron−1; a corresponding experimental urine flow was not reported by Gamble et al.

