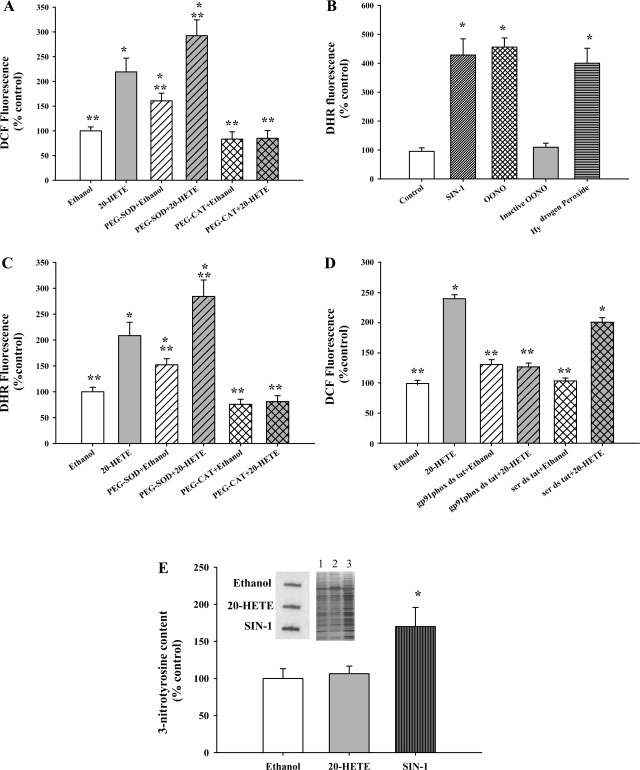
Fig. 1.
20-HETE increases dichlorofluorescein (DCF) and dihydrorhodamine (DHR) fluorescence in bovine pulmonary artery endothelial cells (BPAECs). A: 20-HETE (gray bar) increased the DCF fluorescence compared with vehicle (open bar). PEG-SOD pretreatment (gray hatched bar) enhanced 20-HETE-induced DCF fluorescence signal, indicating facilitated formation of hydrogen peroxide. PEG-CAT treatment (gray cross-hatched bar) effectively lowered 20-HETE-induced DCF fluorescence. Signal remaining after treatment with PEG-CAT represents background, whereas the difference in DCF fluorescence in cells treated with vehicle and 20-HETE reflects hydrogen peroxide. B: an increase in DHR signal was observed with either authentic ONOO− (100 μM) or ONOO− derived from SIN-1 (10 μM), but not with pH-inactivated ONOO−. Hydrogen peroxide (100 μM) also increased the DHR fluorescence. *P < 0.05 relative to control (no treatment). C: BPAECs incubated with DHR123 were imaged for quantitation of fluorescent signal 10 min after treatment with vehicle (open bars) or 20-HETE (gray bars), pretreatment with PEG-SOD (gray hatched bars) or PEG-CAT (gray cross-hatched bars). The same pattern of increased fluorescence signal after PEG-SOD and decreased signal after PEG-CAT treatment as was observed with DCF was detected with DHR123. These data support a major contribution of hydrogen peroxide to 20-HETE-evoked DHR fluorescence signal in BPAECs. D: 20-HETE (gray bar) increased the DCF fluorescence compared with vehicle (open bar). gp91phox ds tat peptide pretreatment (gray hatched bar) effectively lowered 20-HETE-induced DCF fluorescence signal, but not the scr ds tat peptide (gray cross-hatched bar) indicating that NADPH oxidase inhibition lowers 20-HETE-induced production of H2O2. A–D: data are composite of at least 60 cells for each experimental condition and 3 independent culture preparations. *P < 0.05 relative to vehicle control (ethanol); **P < 0.05 relative to 20-HETE. E: BPAECs were treated with ethanol, 20-HETE (1 μM), or SIN-1 (10 μM) for 60 min, and whole cell extracts (3 μg of protein) were used for analysis of tyrosine nitration by slot blot analysis. A representative slot blot image and Western blot are shown in inset. Lanes 1–3 are ethanol, 20-HETE, and SIN-1, respectively. Densitometric quantitation of relative abundance of 3-nitrotyrosine from the slot blots is shown (n = 4 for each group). SIN-1 treatment (dark gray vertical bar) induced an increase in the 3-nitrotyrosine compared with both the vehicle (open bar) and 20-HETE (gray bar). *P < 0.05 relative to both vehicle and 20-HETE.

