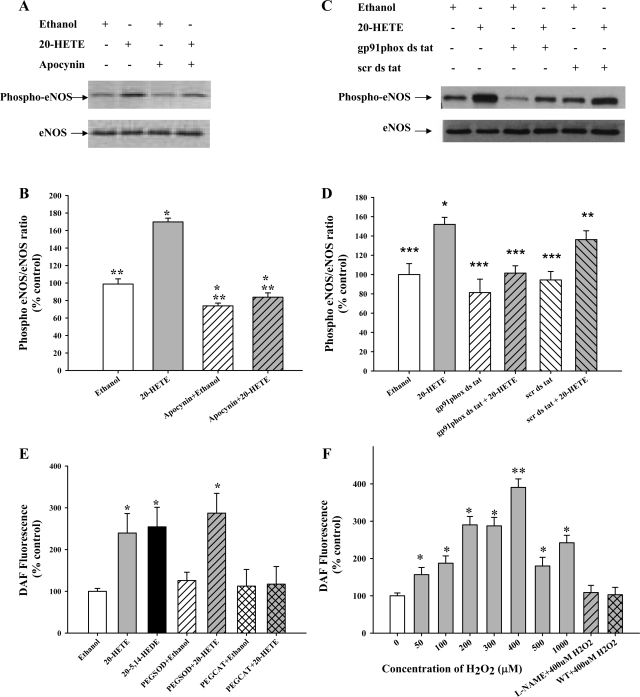
Fig. 4.
20-HETE-induced eNOS (Ser1179) phosphorylation depends on H2O2. NO generation is mediated by H2O2 and PI3K. A: BPAECs were incubated for 30 min with an inhibitor of NADPH oxidase, apocynin (1 μM), before 20-HETE stimulation (1 μM, 30 min). A representative Western blot of cell lysates probed with phospho-eNOS-Ser1179 is shown (top). The blots were stripped and reprobed with eNOS as shown (bottom) (n = 5). B: phospho-eNOS and eNOS bands were analyzed by densitometry and used to calculate the ratio of phospho-eNOS/eNOS. 20-HETE (gray bar) increases phospho-eNOS (Ser1179) compared with vehicle control, and this increase is attenuated by pretreatment with apocynin (hatched bars). *P < 0.05 relative to vehicle control (ethanol); **P < 0.05 relative to20-HETE. C: BPAECs were incubated with the gp91phox inhibitor or the scrambled peptide and treated with 20-HETE or vehicle. A representative Western blot shows that 20-HETE increased phospho-eNOS/eNOS ratio in cells treated with the scrambled peptide, but not the gp91phox peptide. D: 20-HETE (gray bar) increases phospho-eNOS (Ser1179) compared with vehicle control, and this increase is attenuated by pretreatment with gp91phox peptide (hatched bars), but not the scrambled peptide. *P < 0.05 relative to vehicle control (ethanol); ***P < 0.05 relative to scrambled peptide control. E: 20-HETE (gray bar) increased DAF fluorescence (NO levels) compared with vehicle (open bar). Similar to 20-HETE, a stable analog, 20–5,14-HEDE (1 μM, black bar), increased the DAF fluorescence significantly compared with vehicle. The increase in DAF fluorescence was unaffected by PEG-SOD (gray hatched bar; 100 U/ml) and attenuated by PEG-CAT (gray cross-hatched bar; 500 U/ml). *P < 0.05 relative to vehicle control. A total of >50 cells in 3 randomly chosen fields during each experiment was processed for obtaining average fluorescence intensity. F: BPAECs were treated with vehicle or 50–1,000 μM H2O2 for 20 min and then assessed for DAF fluorescence. Starting at 50 μM, H2O2 had a significant effect on DAF fluorescence. Increasing concentrations of H2O2 (gray bars) elicited a bell-shaped response curve, with a peak observed at 400 μM H2O2. Pretreatment with the NOS inhibitor l-NAME (1 mM, gray hatched bar) or PI3K inhibitor wortmannin (200 nM, gray cross-hatched bar) attenuated the DAF fluorescence seen with 400 μM H2O2, suggesting these changes in DAF fluorescence are mediated by activation of PI3K and NOS. Data represent composite results from at least 60 cells for each experimental condition and 3 independent culture preparations. *P < 0.05 relative to no treatment (control, 0 μM H2O2); **P < 0.05 relative to different concentrations of H2O2 used in the study.

