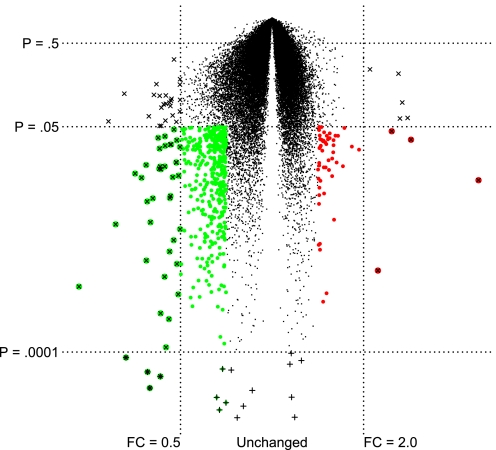
Fig. 2.
Volcano plot showing the average fold change of individual genes (x-axis) compared with P value in a t-test (y-axis) from cystic fibrosis (CF) compared with non-CF nasal brushings (48). Genes marked with × were strongly regulated, with a fold change (FC) greater than 2.0 or less than 0.5. Genes marked with + were highly significant (P < 0.0001), but the fold change was relatively small. Genes marked in color were significant (P < 0.05) and changed by a factor of at least 1.4 or 0.7. Larger colored circles denote greater regulation upward (red) or downward (green).

