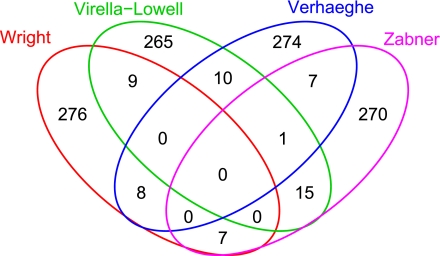
Fig. 3.
Four-way Venn diagram showing genes in common among the 300 most induced (upregulated) genes selected from each of the 4 studies. Note that no genes were strongly induced in all 4 studies. For example, in the red circle [Virella-Lowell et al. (44) study], 265 refers to the number of genes upregulated in the Virella-Lowell data only, 10 refers to the number of genes that are upregulated in both the Virella-Lowell and Verhaeghe et al. (43) study (green circle), and 1 refers to the number of genes that are upregulated in both the Virella-Lowell and Wright et al. (47) study (blue circle). The number 0 in the center that is encircled by all colored circles indicates the number of genes that are upregulated in all 4 studies.

