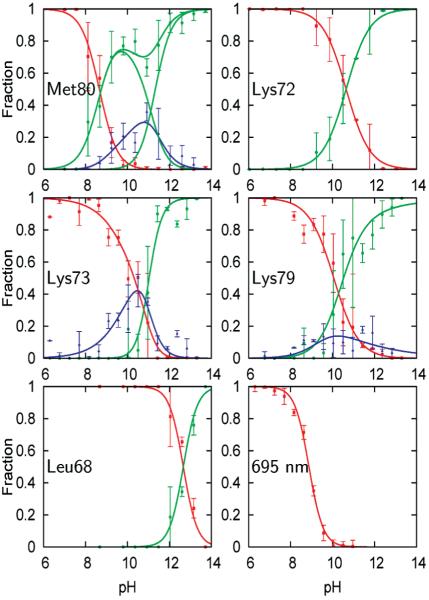
Figure 3.
Fractional concentrations corresponding to folded (red), high pH, solvent-exposed (green), and any intermediate (blue) signals observed at each residue. Also shown are fractional concentrations derived from the intensity of the 695 nm absorption band (lower right panel). Data points (>60 per plot) have been binned into 0.5 pH intervals; error bars represent standard deviations. The curves obtained from model fitting are shown as lines (for details see text).

