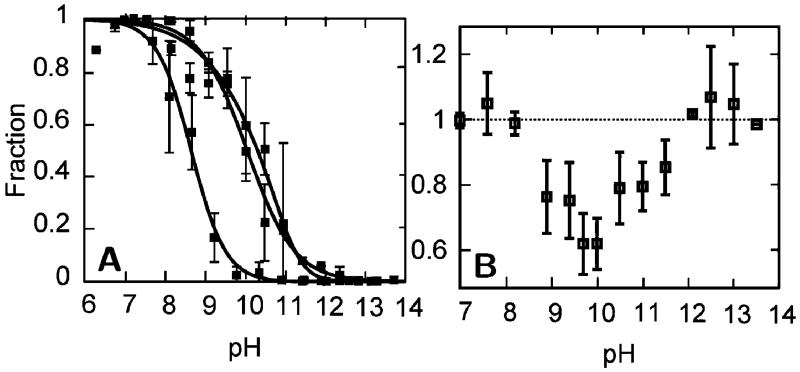
Figure 5.
(A) The fractional concentrations (also shown in Figure 3) of the folded signals for Met80 (lower pH transition) and Lys73/Lys79 (higher pH transitions). (B) Total fractional concentration for heme ligation by Met80, Lys73, Lys79, and lysine replacing ligand(s) calculated by summation of the fractional concentrations of the folded signal at Met80 and the intermediate signals and high pH, solvent-exposed signals at Lys73 and Lys79.

