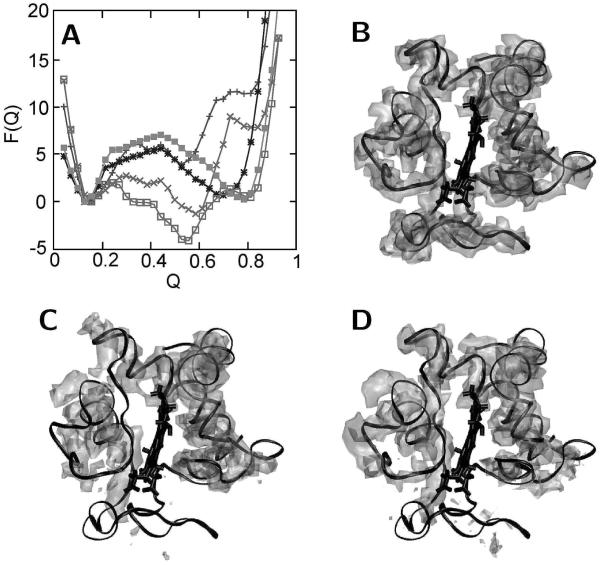
Figure 7.
Results of the minimalist model simulations. (A) Free energy curves as a function of the reaction coordinate Q (related to the fraction of native contacts) obtained from simulation with enforced heme ligation of Lys53 (■), Lys55 (*), Lys72 (+), Lys73 (□), and Lys79 (×). (B–D) Isodensity surface plots determined using structures from the stable free energy basins calculated from simulations for (B) the native state, (C) the Lys73-misligated state, and (D) the Lys79-misligated state. The crystal structure of cyt c (black) is superimposed for comparison (see text for details).

