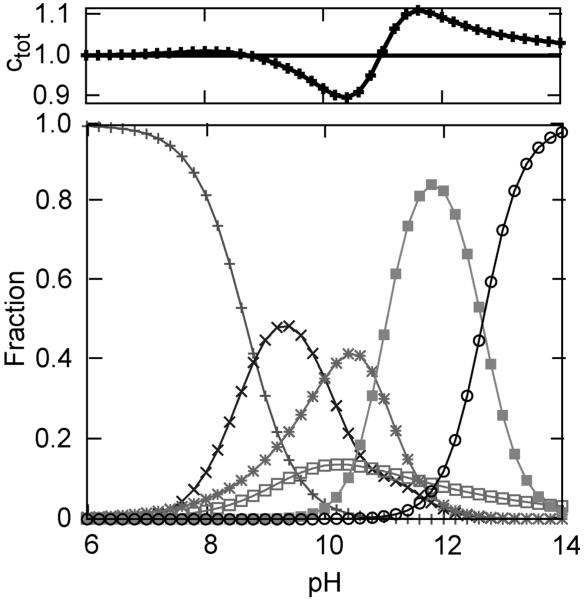
Figure 8.
Fractional concentrations derived by combining signals from Figure 3 to represent states III (+, native), 3.5 (×, neither methionine nor lysine ligated), IVa (*, Lys73 ligated), IVb(□, Lys79 ligated), V (■, hydroxide ligated), and U (○, unfolded). The total concentration (Ctot) obtained by summing over the fractional concentrations of the six states is shown in the upper box. See text for details.

