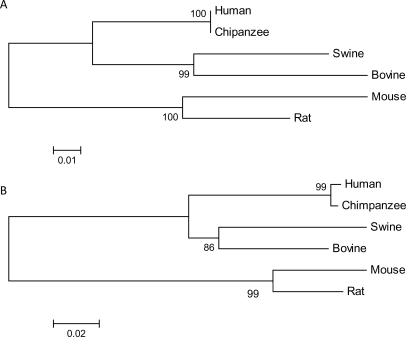
Figure 2.
Phylogenetic tree representing the evolutionary relationship of six mammalian IL23A (A) and IL12B (B) mRNA sequences. Sequences were aligned using ClustalW and a neighbour-joining phylogenetic tree was generated using the maximum composite likelihood method and MEGA4. The tree is drawn to scale and the scale bar represents the same units as the evolutionary distance used to infer the phylogentic tree; base substitutions per site. Reliability of the tree was assessed by bootstrapping, using 1000 bootstrap replications. Numbers at branch nodes represent the confidence level of 1000 bootstrap replications. (A) The human IL23A transcript (H. sapien; NM_016584) is genetically identical to the predicted transcript of the chimpanzee (P. troglodytes; XM_522436). The next closest evolutionary related species is the swine (S. scrofa; NM_001130236), followed by the bovine (B. taurus; XM_588269), rat (R. norvegicus; NM_130410) and finally the mouse (M. musculus; NM_031252). The scale bar represents a genetic distance calculated by the number of base substitutions per site of 0.01. (B) The human IL12B transcript (NM_002187) is highly similar to the predicted transcript of the chimpanzee (XM_527101). The next closest evolutionary-related species is the swine (NM_214013), followed by the bovine (NM_174356), rat (NM_022611) and finally the mouse (NM_008352). The scale bar represents a genetic distance calculated by the number of base substitutions per site of 0.02.

