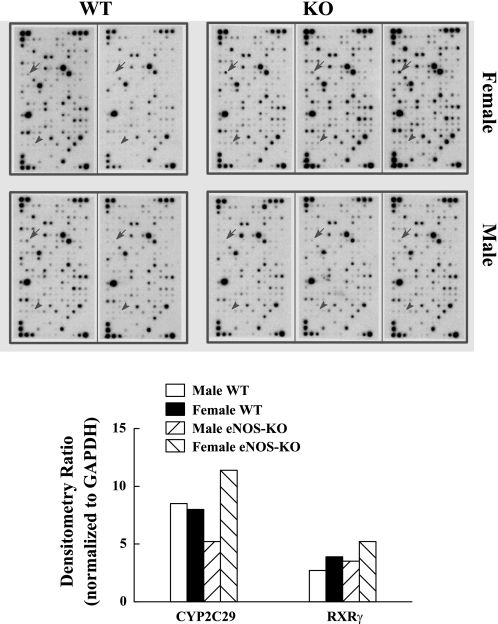
Fig. 1.
Top: microarray of isolated mesenteric arteries of wild-type (WT) male (n = 2) and female (n = 2), and endothelial nitric oxide synthase-knockout (eNOS-KO) male (n = 3) and female (n = 3) mice. A total of 288 (12 × 24) dots representing 263 genes in each array were analyzed. They were numbered in rows from the top-left to the bottom-right sequentially. Dots 1, 2, and 13 are the genes for GAPDH, used to normalize loading variations. Dots 86 (indicated by arrows) and 231 (indicated by arrowheads) are the genes for CYP2C29 and retinoid X receptor γ (RXRγ), respectively. Bottom: summarized densitometry ratio normalized to GAPDH (dot 2).

