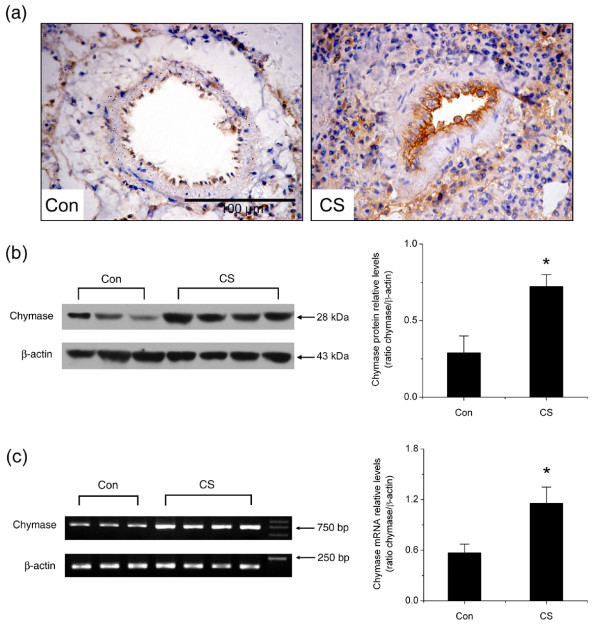
Figure 2.
Changes in chymase protein and mRNA levels in hamster lungs. (a) Representative chymase immunohistochemical staining in pulmonary arterioles (original magnification × 40). (b) Representative Western blotting analysis of chymase protein levels in hamster lungs. (c) Representative RT-PCR analysis of chymase mRNA levels in hamster lungs. Con: control group; CS: cigarette smoke-exposed group. Scale bars = 100 μm. Data are expressed as mean ± SD (n = 3 for control group and n = 4 for smoke-exposed group). * P < 0.05, significant difference from the control group.

