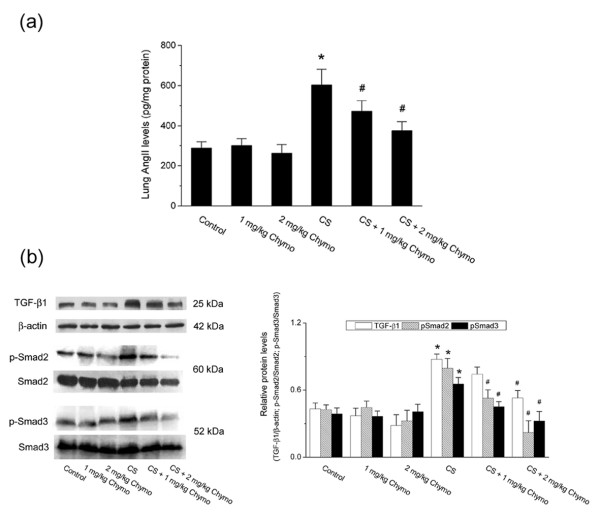
Figure 5.
Changes in Ang II levels and TGF-β1/Smad signaling activation in hamster lungs. (a) Ang II levels. Values are expressed as mean ± SD (n = 6). (b) Protein levels of TGF-β1, β-actin, p-Smad2, Smad2, p-Smad3 and Smad3 measured by Western blotting analysis. Images are representative of three independent experiments. Relative protein levels were assessed by densitometry. Control: control group; CS: cigarette smoke-exposed group; Chymo: chymostatin treatment. * P < 0.05, significant difference from the control group. # P < 0.05, significant difference from the smoke-exposed group.

