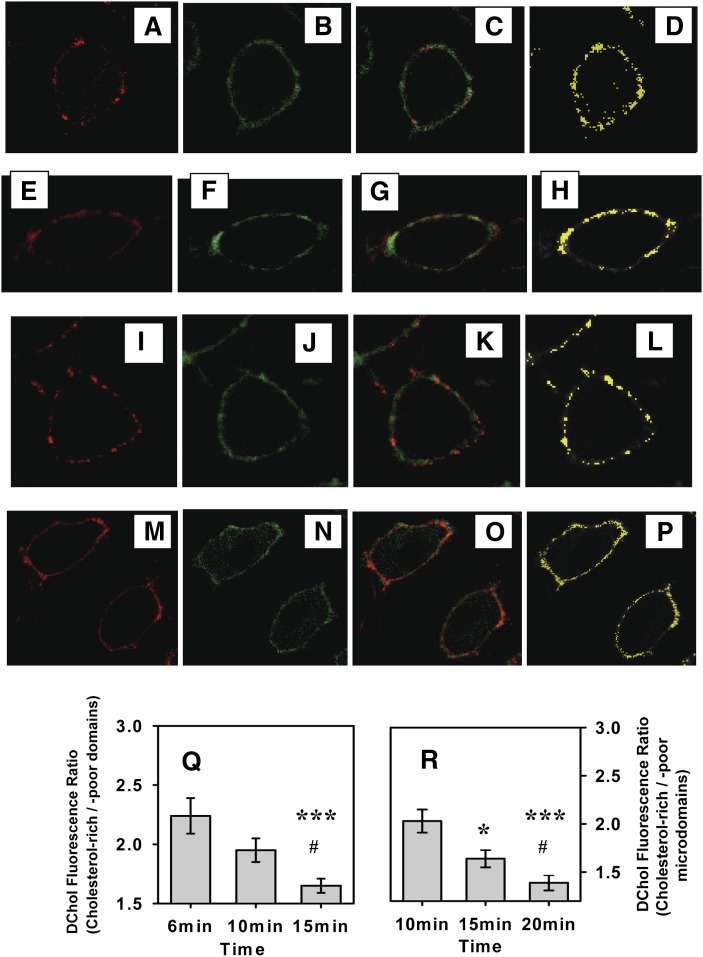
Fig. 2.
Colocalization of DChol with different microdomain markers in living cells. L-cells were double labeled with DChol and another membrane domain marker, which were then simultaneously imaged through separate photomultipliers as described in Methods. Images of DChol are shown in green in B, F, J, and N. The images of membrane domain markers are shown in red: Alexa Fluor 594 CT-B (A), DiD (E), BCθ (I), and N-Rh-DOPE (M). The superposition of red and green images are shown in C, G, K, and O, and the yellow colocalized pixels are shown in D, H, L, and P. Changes in DChol uptake into cholesterol-rich and -poor microdomains with time were followed by measuring the ratio dansyl fluorescence (cholesterol-rich/-poor microdomains) with time based on DChol colocalization with Alexa Flour 594 CT-B as shown in Q. ***, Significantly different from 6 min (P < 0.001); #, significantly different from 10 min (P < 0.05). R: DChol fluorescence distribution (cholesterol-rich/-poor microdomains) with time based on colocalization with DiD. *, Significantly different from 10 min (*, P < 0.05, ***, P < 0.001); #, significantly different from 15 min (P < 0.05).

